Environmental Health Impact Checker
Your Environmental Health Assessment
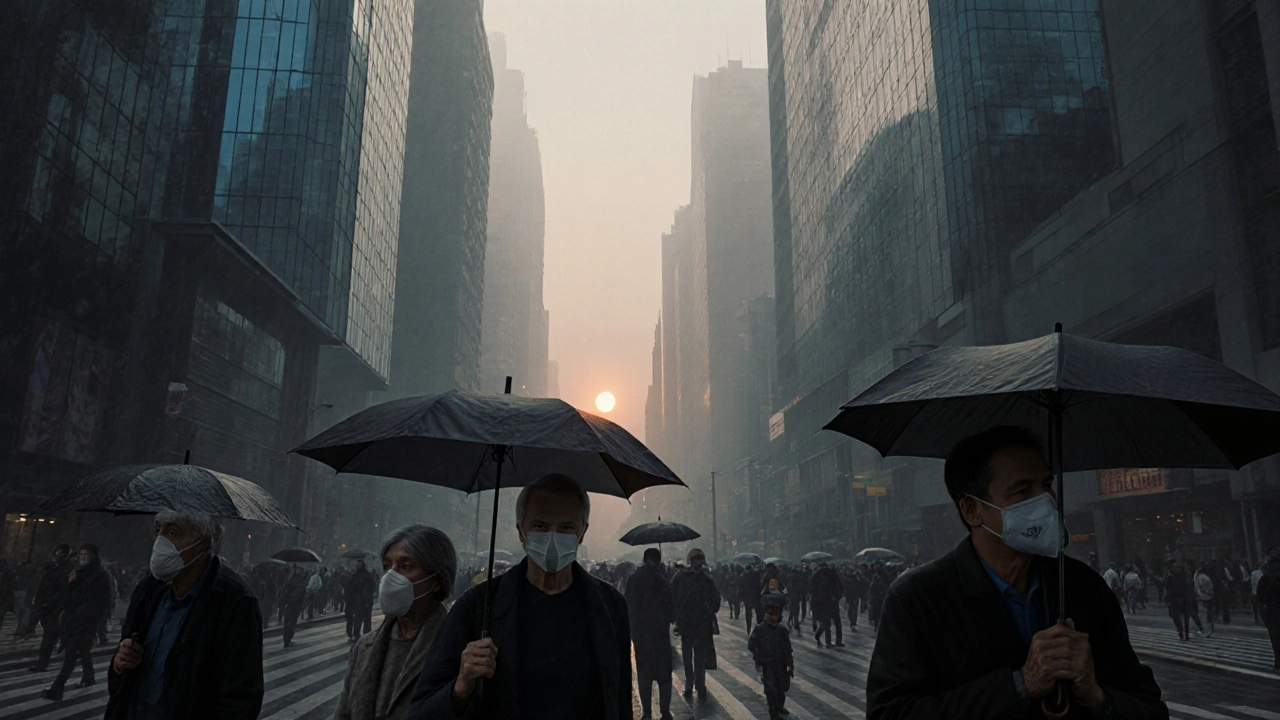
Ever wonder why you catch a cold on a smoggy morning or why summer heat spikes asthma attacks? The answer lies in the environment around you. From the air you breathe to the noise outside your window, each factor nudges your body toward illness or wellness. Below you’ll find a practical rundown of the biggest environmental players, how they affect specific health outcomes, and what you can do right now to protect yourself.
Key Takeaways
- Air pollution is the top global risk factor for premature death, driving respiratory and cardiovascular disease.
- Contaminated water remains a leading cause of gastro‑intestinal infections, especially in low‑resource settings.
- Noise exposure raises blood pressure and can trigger heart attacks even at modest decibel levels.
- Extreme temperature and humidity strain the cardiovascular and thermoregulatory systems, increasing heat‑stroke risk.
- UV radiation is the main preventable cause of skin cancer, but smart sun habits cut the risk dramatically.
Understanding Environmental Factors
Environmental factors are the physical, chemical, and biological elements in our surroundings that influence bodily functions. They range from visible pollutants to invisible ultraviolet rays, and each interacts with our immune system, metabolism, and genetics in unique ways. While genetics set the baseline, the environment decides how often that baseline is tested.
Air Pollution and Respiratory Illness
Air pollution a mixture of particulate matter (PM2.5, PM10), nitrogen oxides, sulfur dioxide, and volatile organic compounds released from traffic, industry, and wildfires is responsible for roughly 7 million premature deaths each year, according to the WHO. Fine particles (PM2.5) penetrate deep into the lungs, inflaming alveoli and entering the bloodstream. Short‑term spikes in PM2.5 raise emergency‑room visits for asthma and COPD, while long‑term exposure doubles the risk of chronic bronchitis.
Real‑world example: In Melbourne’s 2024 winter smog episode, hospital admissions for asthma jumped 22% over a five‑day period. The uptick mirrored satellite data showing a sudden rise in PM2.5 from 12µg/m³ to 45µg/m³.
What you can do
- Check air‑quality apps; stay indoors when the AQI exceeds 100.
- Use HEPA‑filtered air purifiers in bedrooms.
- Wear N95 masks on heavily polluted days, especially during commute.
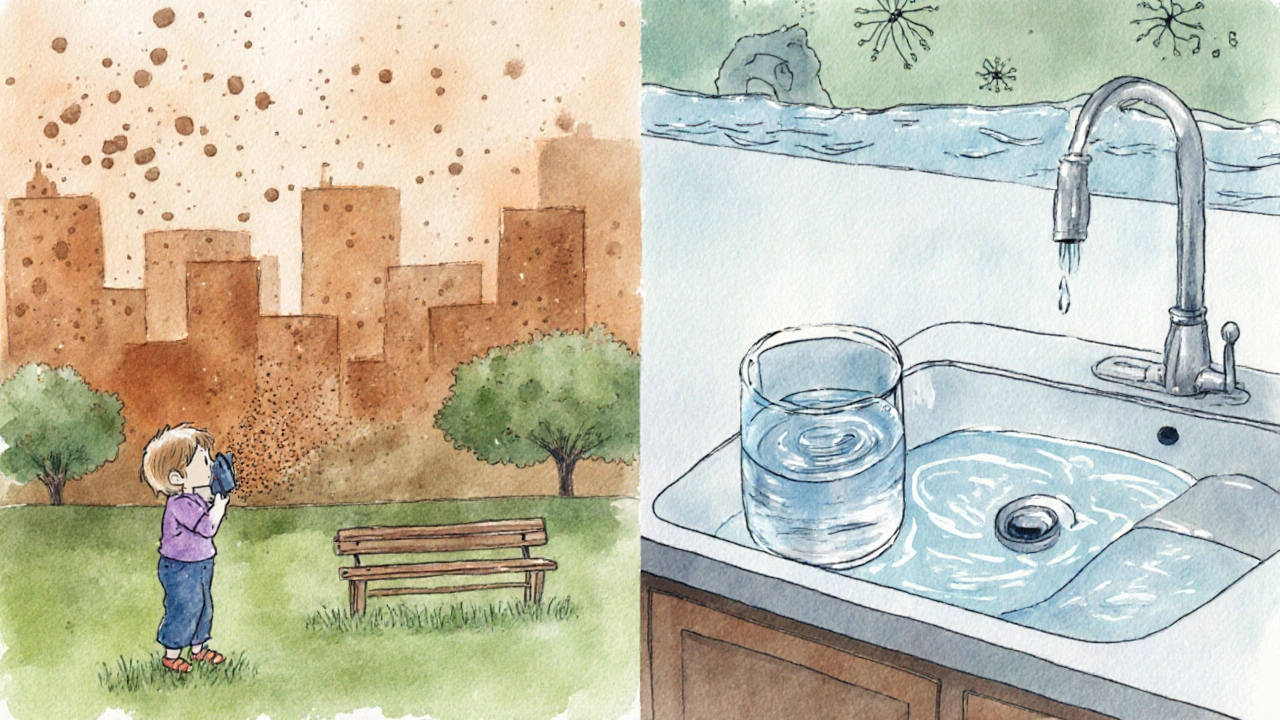
Water Quality and Gastrointestinal Health
Water quality the chemical and microbial purity of drinking water, including presence of pathogens, heavy metals, and disinfectant by‑products determines whether your gut stays healthy or battles infection. In 2023, the CDC reported that 2.2million cases of water‑borne disease occurred in the U.S., with Cryptosporidium and E. coli as top culprits.
Contaminants like lead impair neurological development in children, while chlorine‑generated trihalomethanes have been linked to bladder cancer after decades of exposure.
Practical steps
- Use certified carbon filters for tap water to remove chlorine and heavy metals.
- Boil water for at least one minute before drinking during boil‑water advisories.
- Prefer bottled water only when local supplies are confirmed unsafe.
Noise Pollution and Cardiovascular Stress
Noise pollution unwanted or harmful outdoor sound from traffic, construction, aircraft, or urban nightlife measured in decibels (dB) isn’t just annoying-it raises cortisol, spikes blood pressure, and can trigger arrhythmias. A European cohort study in 2022 linked an average night‑time noise level of 55dB to a 14% higher risk of ischemic heart disease.
Tips to lower exposure
- Install double‑glazed windows or acoustic curtains.
- Use white‑noise machines or earplugs while sleeping.
- Advocate for low‑noise road surfaces in your neighbourhood.
Temperature Extremes, Humidity, and Heat‑Related Illness
Temperature extremes periods of unusually high or low ambient temperature, often accompanied by high humidity, that challenge the body’s thermoregulation are becoming more frequent with climate change. Heat‑stroke risk rises dramatically when the wet‑bulb temperature exceeds 35°C, a threshold already recorded in parts of Australia during 2024 heatwaves.
Cold snaps, on the other hand, increase blood‑clot formation, leading to higher rates of stroke and myocardial infarction in the weeks after a sudden temperature drop.
Protective habits
- Stay hydrated; aim for 2‑3L of water per day in hot weather.
- Dress in breathable, light-colored fabrics and seek shade during peak sun hours.
- In cold conditions, layer clothing and keep extremities covered.
UV Radiation and Skin Cancer
UV radiation the portion of sunlight with wavelengths between 280‑400nm that penetrates the skin, causing DNA damage is the leading preventable cause of melanoma and non‑melanoma skin cancers. The Australian Cancer Council estimates that 1 in 4 Australians will develop skin cancer by age 70.
Even on cloudy days, up to 80% of UV rays reach the surface, making sunscreen a year‑round necessity.
Simple defenses
- Apply broad‑spectrum SPF30+ sunscreen 15minutes before going outdoors, reapply every two hours.
- Wear wide‑brim hats, UV‑protective sunglasses, and UPF clothing.
- Seek shade between 10am and4pm when UV index peaks.
Climate Change Amplifying Risks
Climate change the long‑term shift in temperature, precipitation, and weather patterns driven largely by greenhouse‑gas emissions magnifies every other environmental factor. Warmer oceans boost harmful algal blooms, contaminating seafood. Increased wildfire activity raises PM2.5 levels far beyond city limits, exposing rural populations to urban‑level air pollution.
Modeling from the IPCC 2023 report predicts a 15% rise in vector‑borne diseases like dengue by 2050 as mosquitoes thrive in hotter, wetter climates.
Individual actions that matter
- Reduce personal carbon footprint: use public transport, cycle, or drive an electric vehicle.
- Support renewable energy through green electricity tariffs.
- Participate in community tree‑planting or local clean‑up events.

Summary Table of Major Environmental Factors
| Factor | Common Sources | Acute Health Effect | Chronic Health Effect |
|---|---|---|---|
| Air Pollution | Traffic, industry, wildfires | Asthma flare‑up, eye irritation | COPD, heart disease, lung cancer |
| Water Quality | Municipal supply, agricultural runoff | Gastro‑enteritis, skin rash | Lead neurotoxicity, cancer from contaminants |
| Noise | Road traffic, construction, airports | Stress, sleep disturbance | Hypertension, ischemic heart disease |
| Temperature/Humidity | Heatwaves, cold snaps | Heat‑stroke, hypothermia | Cardiovascular strain, respiratory complications |
| UV Radiation | Sunlight, tanning beds | Sunburn | Melanoma, premature skin aging |
Mitigation Strategies for Individuals
While policy change is crucial, every person can layer simple habits to cut exposure. Think of a “health‑shield” checklist: monitor air quality, filter drinking water, control indoor noise, stay temperature‑aware, and protect skin from UV. Combining these steps reduces cumulative risk by up to 30% according to a 2022 meta‑analysis of cohort studies.
Policy and Community Actions
Governments and local councils play a pivotal role. Effective measures include stricter emissions standards, investment in green public transport, establishing low‑noise zones, upgrading water treatment infrastructure, and enforcing UV‑protective guidelines for outdoor workers. Communities benefit from citizen‑science programs that crowdsource air‑quality readings, empowering residents to demand cleaner policies.
Frequently Asked Questions
How quickly can I see health improvements after reducing exposure to air pollution?
Within a few days of moving to cleaner air, lung function can improve by up to 10%, and inflammation markers drop. Long‑term benefits like reduced cardiovascular risk become measurable after several months of sustained low exposure.
Is boiling water enough to eliminate all contaminants?
Boiling kills microbes but does not remove chemical pollutants such as lead or arsenic. For those, certified filtration or certified bottled sources are required.
Can wearing headphones all day increase my risk of hearing loss?
Yes, sustained volumes above 85dB for more than an hour a day can cause permanent damage. Use the 60/60 rule: 60% volume for no longer than 60 minutes before a break.
What is the safest sunscreen ingredient?
Mineral filters like zinc oxide and titanium dioxide are considered safest because they sit on the skin surface and rarely cause hormone disruption, unlike some chemical filters.
How does climate change increase allergy season length?
Warmer springs cause plants to flower earlier and for longer periods, releasing more pollen. Studies from 2023 show a 20% increase in pollen counts in the southern hemisphere compared to the 1990s.

Comments
What a vivid tapestry of environmental variables! Your interactive checker reminds me of a digital kaleidoscope, constantly shifting with each data point. The way you break down AQI, noise, and UV is both educational and engaging. Folks can really see how seemingly innocuous factors blend into a health narrative. Keep spreading this colorful awareness – the more we know, the better we can protect ourselves.
The modern human stands at the crossroads of civilization and nature, a junction fraught with invisible hazards that whisper into our lungs and echo through our nervous systems. One might argue that the very air we inhale is a silent contract, a pact between industry and individual well‑being, often broken without our notice. When the AQI climbs into the realm of "Unhealthy for Sensitive Groups," it is not merely a number but a herald of cellular stress, a subtle reminder that our urban sprawl exacts a toll. Noise, that relentless hum, does more than irritate; it disrupts circadian rhythms, turning our sleep into a precarious gamble. Temperature extremes, whether scorching suns or biting frosts, act as hidden autopsies, gradually eroding our physiological resilience. UV radiation, that invisible yet potent force, can inscribe DNA damage across generations, a legacy written in the skin’s very fabric. Water quality, often taken for granted, carries pathogens and pollutants that can silently infiltrate our bodies, spawning chronic ailments. The synergy of these factors creates a mosaic of risk, each tile influencing the next. It is therefore essential to approach environmental health with a philosopher’s mind, dissecting each variable and its cascading effects. The interactive tool you present is a commendable step toward democratizing this complex knowledge, translating data into actionable insight. Yet, we must remember that data alone does not compel change; societal will and individual agency must converge. By internalizing these metrics, we not only safeguard our own health but also become ambassadors for a cleaner, quieter, and more balanced world. In the end, the true measure of progress lies not in the numbers on a dashboard but in the breaths we take, the sleep we enjoy, and the lives we lead.
Honestly, all this western‑centric whining about "environmental health" is just a distraction from our real issues. While they babble about AQI numbers, our own nations suffer from the true scourge of mismanagement. If you think a flashy checker can solve the deep-rooted problems, you’re living in a fantasy.
Great effort on bundling these variables into a single interface! From an expert standpoint, adding a real‑time data feed could elevate the tool's usefulness. Users would benefit from seeing live AQI trends rather than static selections. Also, integrating a personal health profile could tailor recommendations even further. Keep iterating – the impact could be huge.
Awesome tool!.
The interplay between temperature and humidity often escapes layperson's notice, yet it governs our thermoregulatory comfort. When the humidity breaches the 70% threshold, we encounter a phenomenon known as heat index amplification, compounding perceived temperature. Conversely, sub‑30% humidity in frigid climates can exacerbate evaporative cooling, leading to hypothermic risk. Your checker could benefit from displaying a heat index metric alongside raw temperature data. Moreover, offering guidance on adaptive clothing layers would empower users to mitigate these hazards. Ultimately, such nuanced insight strengthens personal agency in environmental health.
Love seeing practical tips for everyday folks! Stay hydrated and adjust clothing based on those humidity cues – simple but effective. Encourage friends to try the tool and share their results.
From a developer’s perspective, the modular CSS classes (e.g.,
.impact-level-high) demonstrate a clear separation of concerns. This approach facilitates future extensions, such as adding new environmental categories without overhauling the frontend. Additionally, leveraging semantic HTML improves accessibility for screen readers. It would be prudent to incorporate ARIA labels for interactive elements to further enhance usability. Overall, the codebase reflects solid engineering principles.yeah, nice but where's the mobile version??
Don't be fooled by the sleek interface – there's a hidden agenda to keep us complacent. The powers that be want us to think a simple checkbox can replace real activism. Meanwhile, they pump clandestine chemicals into our water and spread misinformation about UV safety. You should question who funds these tools and why they omit certain data points. Remember, the truth is often buried under layers of polished UI.
Your concerns highlight the need for transparency in data sources. Providing citations for AQI readings and water quality indices would bolster credibility. Additionally, offering an open‑source repository could allow community audits. By embracing openness, the tool can become a trusted resource rather than a veiled instrument. Consider these steps to align the project with ethical standards.
While many applaud the user‑friendly design, I find the underlying assumptions rather simplistic. The categorization of "low", "medium", and "high" risk fails to capture the socioeconomic gradients that exacerbate exposure. Furthermore, the model appears to treat each factor in isolation, ignoring synergistic effects that could amplify health outcomes. A more sophisticated multivariate analysis would be appropriate, perhaps leveraging machine learning to predict individualized risk profiles. Also, the reliance on static thresholds disregards regional variations in baseline tolerances. For instance, populations accustomed to higher UV indices may exhibit adaptive physiological responses not accounted for here. In addition, the absence of temporal trends-such as seasonal fluctuations in AQI-limits the tool's predictive power. Finally, the aesthetic choices, though modern, sometimes sacrifice readability, especially for users with visual impairments. In short, commendable effort, but considerable refinement is required to meet the standards of rigorous environmental health assessment.
Appreciate the detailed critique! We’ll look into incorporating regional data and dynamic thresholds. Stay tuned for updates that address these nuances.